
Introduction:
Supply Chain Management involves the management of all the different processes and activities at each step that leads to value created in the hands of ultimate consumer. Modern day Supply Chain Planners are responsible for most of these processes and activities like forecasting sales, monitoring and managing global inventories, plan production and purchasing activities for materials needed while tracking delivery performance and response times as well as handle capacity constraints and logistics issues.
As you can imagine this is a very challenging job, especially more so as the Supply Chain Planners are tasked with optimizing value in the entire supply chain from the Supplier’s supplier to the very end consumer. Companies are recognizing the importance of incorporating supply chain strategy into their overall planning process which is increasing the pressure on the Supply Chain Planners and Managers. Some of the Key challenges for modern day Supply Chain Planners are:
- Predicting the right levels of Sales Forecasts and Production Levels
- Managing Uncertainty of Demand
- Adapting to the Risk in modern day Global Supply Chains
- Meeting Customer Demand in the most optimum while Reducing Costs and Inventory Levels
- Monitor Exceptions to work on the Vital Few, rather the Trivial Many.
In this blog, we will look at the various processes that modern day Supply Chain Planners and Managers are required to do, in order to manage these critical challenges. We will also look at some of the key features of the Oracle SCM Cloud Applications that make these tasks relatively easier and assist the Planners in carrying out their Day-to-day activities.
Key Process Flows in Supply Chain Planning:
Supply Chain Planning in the modern days has become so complex that most companies will further divide it into more manageable job roles.
We will use the following further divisions of Supply Chain Planning and Management roles, in this blog to illustrate the features of Oracle SCM Cloud Applications:
- Demand Planner
- Sales Manager
- Customer Support Planner
- Inventory Planner
- Supply Planner (Production Planner)
- Operations Manager
At an overall process point of view, the High Level Process Flow of Supply Chain Planning and Management could be represented as follows:
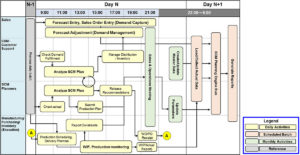
Typically, Data Collection is run after all the business transactions are posted for the day as a scheduled batch job first thing in the night batch. Data Collection will collect all the Master and Transactional data required for the Planning processes. After Collection, an Integrated Demand and Supply Planning batch job can be run to plan for Demand and Supply together and create the Forecast and Supply recommendations.
The Planners come in the morning and start reviewing the plan output in terms of the their respective KPIs, Exceptions and Business Measures relevant to their role. They analyze the plan thoroughly, take the necessary corrective actions and finally release the planning recommendations to execution system.
During the work day, dynamic changes may happen with respect to demands, supplies, resources, BOM, Routings or any other planning data elements. To evaluate the impact of these intraday changes the planner may run numerous simulations to quantify the impact on the plan.
In this High Level, Process Flow the divisions of roles is as follows:
For the Planning Roles:
For the Management Roles:
Key Features of the Oracle SCM Cloud Application:
The best way to start analyzing the health of the plan is through plan summary Dashboards which can provide a bird’s eye view of the plan. Plan Summary Dashboard is a high-level graphical overview of a plan’s performance. It measures plan performance against a company’s targets. The first step for a Planner will be to open the plan summary page and take a look at important measures/KPIs. These Measures/KPIs can be configured based on the company’s business objects and can be made specific to the role of the different Planners and Managers.
On the summary dashboard page, there are configurable KPIs represented as InfoTiles which can be viewed straight away. Each infotile has one or more related graphs with predefined drill-to-actions to display additional information about that KPI. The planner will then use the ‘drill-to-actions to further analyze the plan. In the following sections,we will explore the various dashboards with KPI and Exception Infotiles for each role.
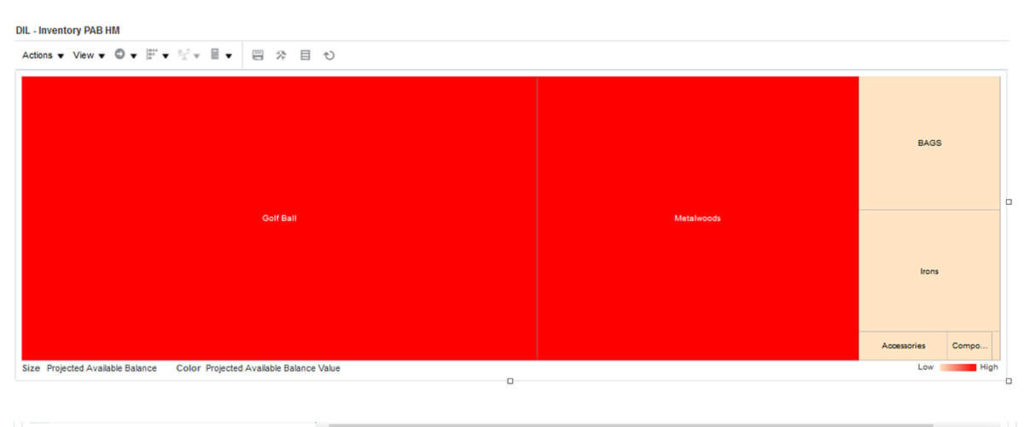
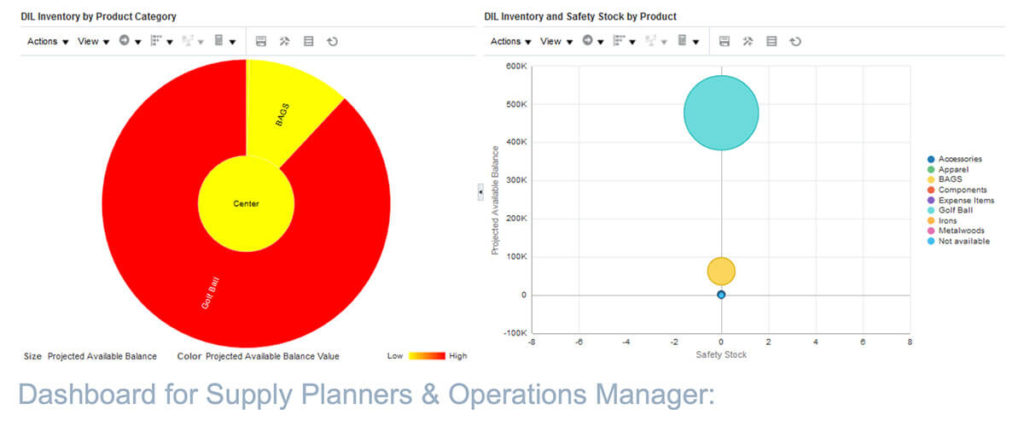
Material Plan is a predefined, time-phased view of the material across the plan horizon for any item/organization combination. Planners can use material plans to view supply/demand measures/KPIs like Safety stock, PAB, total supplies, total demand. They can drill to other pages as required. It is a nice tool to get a bird’s eye view of time phase projected inventory levels. As a part of best practice, review material plans for all important categories/items.
Once the plan is analyzed, it is time for the planner to release the orders to source. The orders that were firmed by accepting the expedite recommendation need to be marked for release using the Supplies and Demands UI before they can be released. Expedited orders can be selected by drilling from the expedite recommendations to supplies and demands, which will automatically filter supplies and demands to show the expedited
order, or the planner can open supplies and demands separately and filter for all firmed orders.
Once the planner has located the orders they want to release, they can view the release-related fields using a pre-seeded layout called “Release”. To mark the order, or orders, for release, select the desired orders and select the Mark for Release action from the Actions menu. Upon completion of the Mark for Release action, the release status will be “Marked for Release”.
Finally, after marking orders for release, the planner would release the order back to Execution system (Oracle Fusion) by selecting the Release plan action found on the page-level Actions menu.
During the day, if the Demand/Supply picture changes or if the planner would like to simulate effect of Item or supply chain related attribute changes then the planner can run the simulation plan and analyze the effect of those changes on the plan output.
Dashboard for Demand Planners:
The Demand Planner would be interested in the following KPIs/Exceptions:
- Forecast Accuracy of the System generated Statistical Forecast
- Forecast Accuracy of the Customer/Sales & Marketing Team entered Sales Forecast
- Forecast Comparison between the Statistical and Sales Forecasts
- Forecast Comparison between This Year versus Last Year (over time)
- Revenue and Margin projections, as per current plan
A Summary Dashboard should be configured with the above KPIs and Exception Summaries as follows, where he/she can analyze the above metrics.
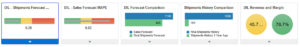
The Statistical Forecast generated by Oracle system is called Shipments Forecast, as it is generated using the Shipments History of the organization. The industry standard measure of Forecast Accuracy is called Mean Absolute Percentage Error (MAPE).
By clicking on the Shipments Forecast MAPE/Sales Forecast MAPE Infotiles the Planner is provided with a more detailed graphical/tabular analysis based upon the Product Categories as follows:
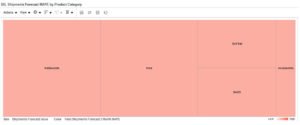
This is a Heatmap of the MAPE by Product Category, where the Planner can easily see the categories which need more attention. From here the Planner can drill to the Forecast Analysis and Forecast Decomposition to look into/adjust the Shipments History or the causal factors.
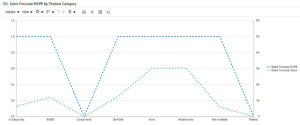
This can also be represented as a Simple Graph as follows, with similar drill to capabilities.
The Forecast Comparison Infotiles also provide more detailed graphical representation by Period or Product Category to better model the seasonal/categorical trends. From here the Planner can drill to the Forecast Analysis and Forecast Decomposition to look into/adjust the Shipments History or the causal factors.
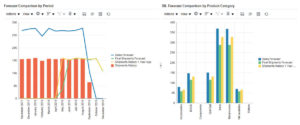
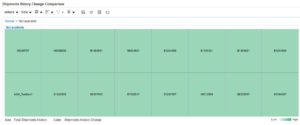
Or the planner can also look at the Shipments History Change by Product/Category to identify the growth rate over the relevant period of time. This can be configured as per the business/industry standards.
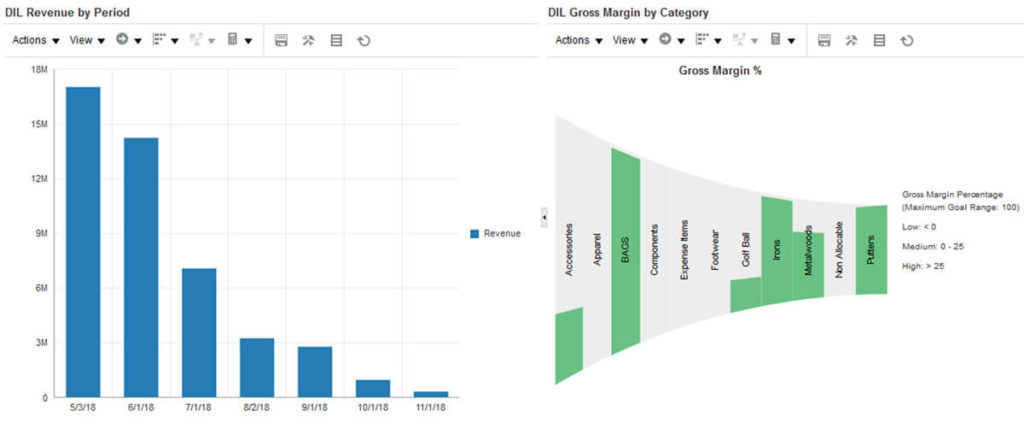
The Demand Planner can also look at Revenue by Period or Category to identify profitable Product Categories or monitor sudden demand changes by drilling into the Order Comparison from the Revenue graphs and comparing with achieved plans.
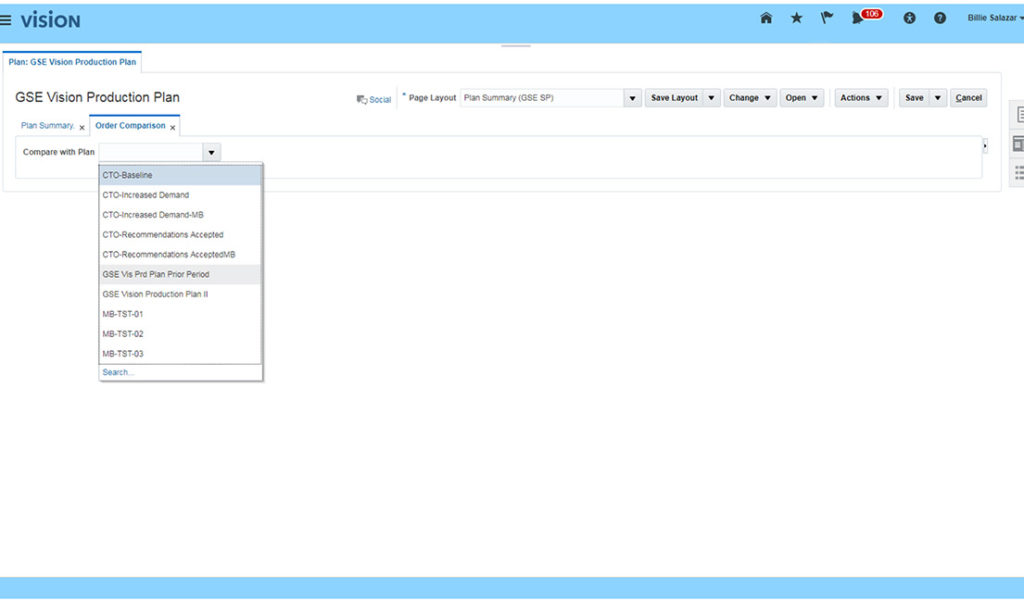
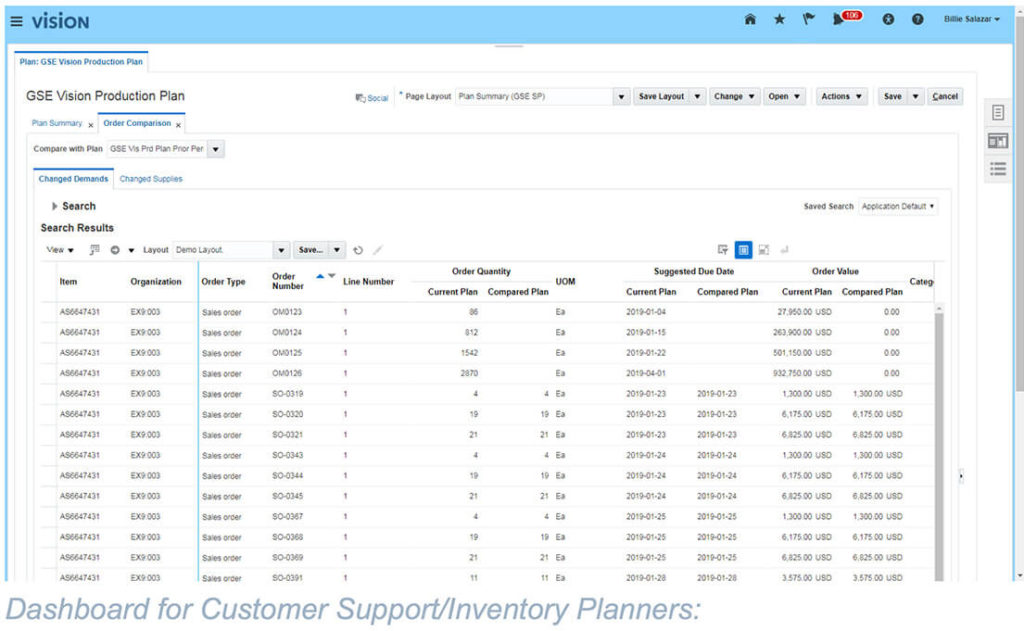
The process to monitor demand changes is as follows:
The process to monitor demand changes is as follows:
Drill to Order Comparison page, and compare with a prior version of the plan.
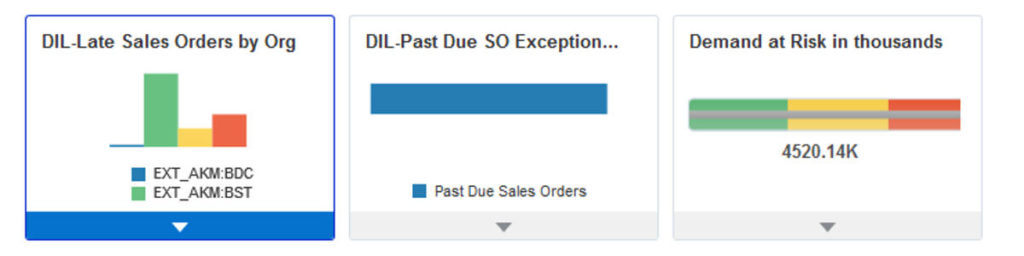
The Customer Support/Inventory Planner would be interested in the following KPIs/Exceptions. A Summary Dashboard should be configured with the above KPIs and Exception Summaries as follows, where he/she can analyze the above metrics.
Demand Fulfillment:
- Demand Fulfilment Exceptions by Region/Distribution Center
- Demand Fulfilment Exceptions by Product Category
- Demand at Risk Analysis
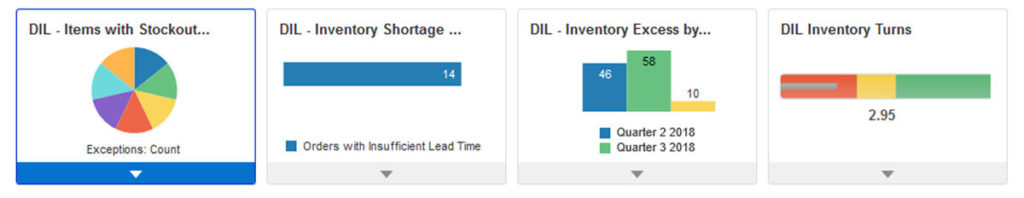
Inventory Analysis:
- Projected Inventory Stock-out Exceptions
- Projected Inventory Shortage & Excess
- Inventory Turns projections, as per current plan
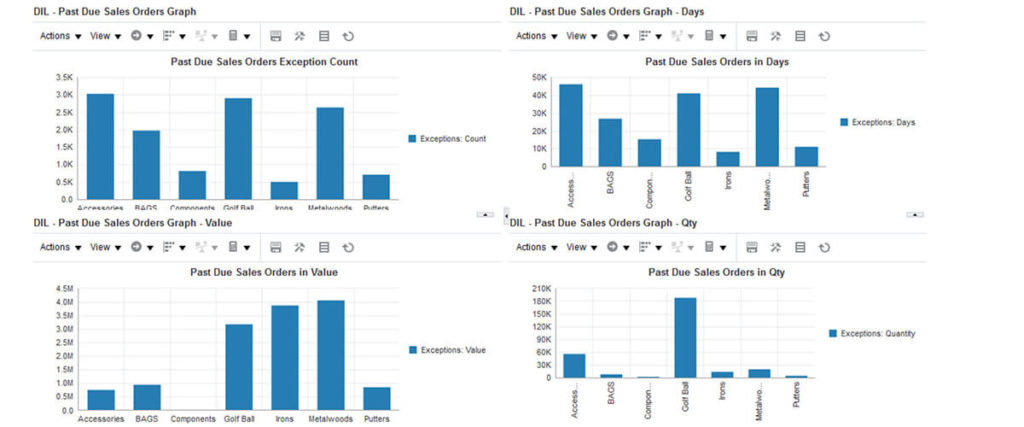
Demand Fulfillment:
Each Region or Distribution Center is modelled as an Organization in Oracle and Plan can report Exceptions at this level to look at Regional/DC level issues in Demand Fulfilment.
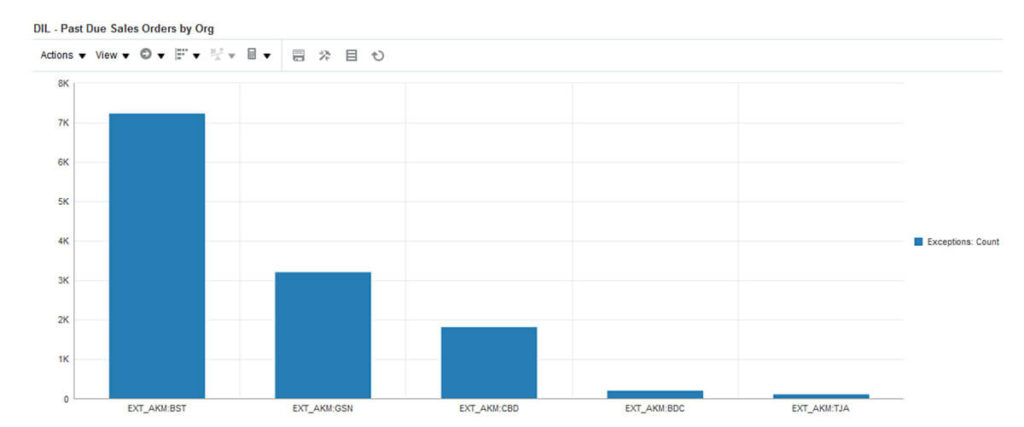
From this detailed graph the Planner can look in to the Orgs with most number of Exceptions and drill to the Supply and Demand of this Region or further drill into the Product Category level or look at the other Measures by Days, Quantity or Value to be more precise and target the Vital few, instead of the Trivial many.
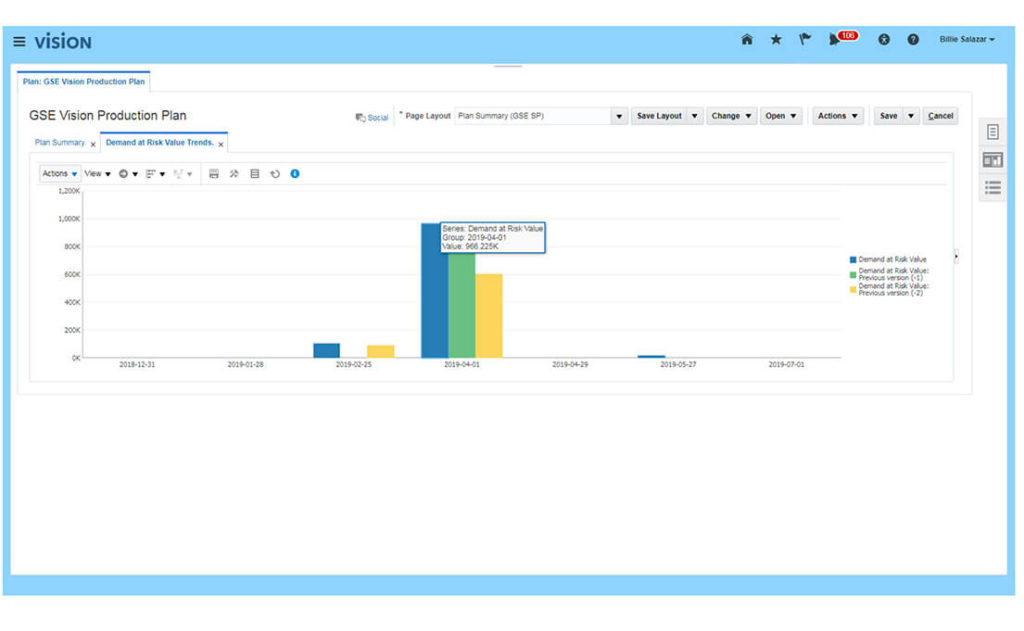
have put revenue of a particular item (in green) at risk in Demand at Risk Summary tree graph. From here the Planner can drill to the Demand at Risk Value Trends
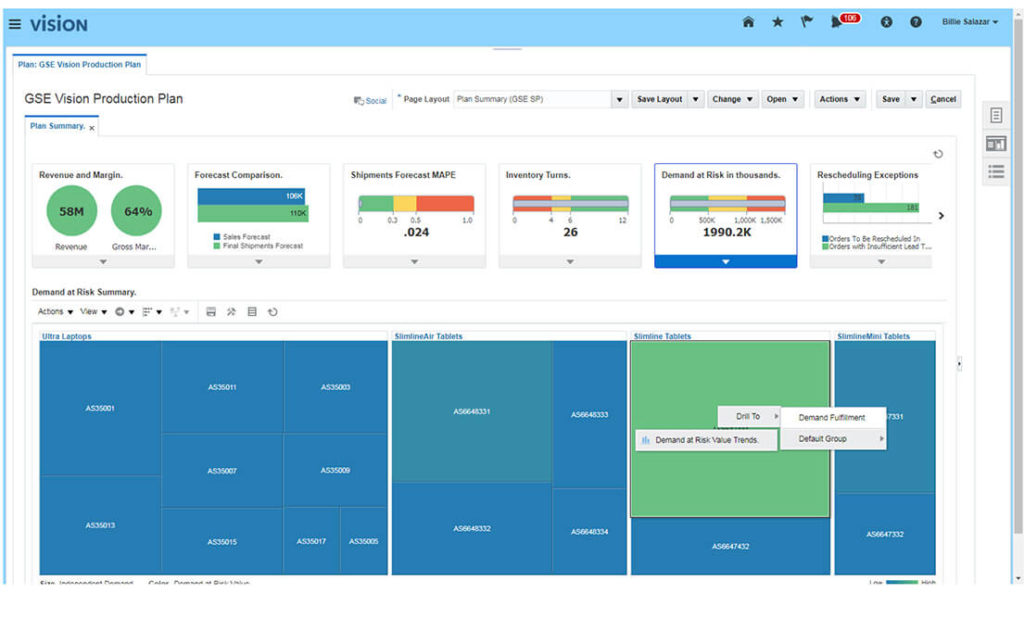
Compare value trends of demand at risk for item with previous runs of the same plan. This confirms new demand orders are causing demand at risk.
Compare value trends of demand at risk for item with previous runs of the same plan. This confirms new demand orders are causing demand at risk.
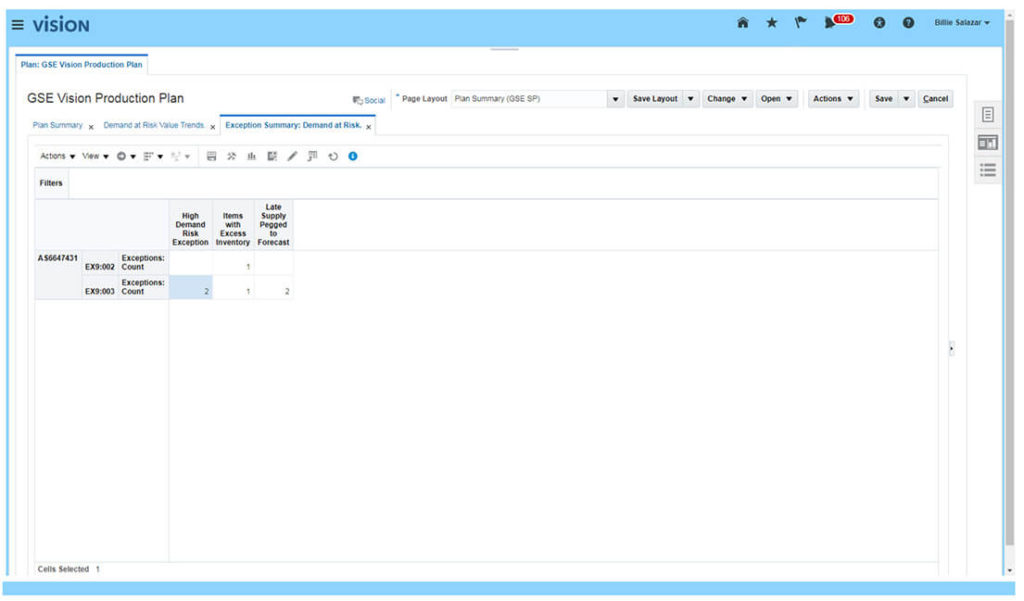
The planner drills down to the Exception Summary: Demand at Risk to find out which planning exceptions are associated with the item. Planning exceptions are automatically created when plan is run. A High Demand at Risk exception condition is met whenever a demand at risk of an item is above a 10% of it’s revenue value.
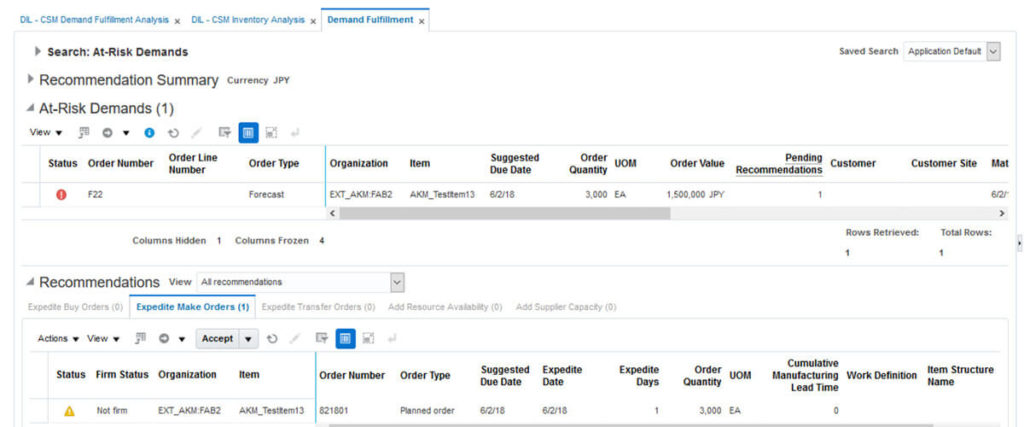
From the Exceptions Summary, the planner can drill to the Build Plan to analyze the demand and supply at all stages of the entire Supply chain of the Item.
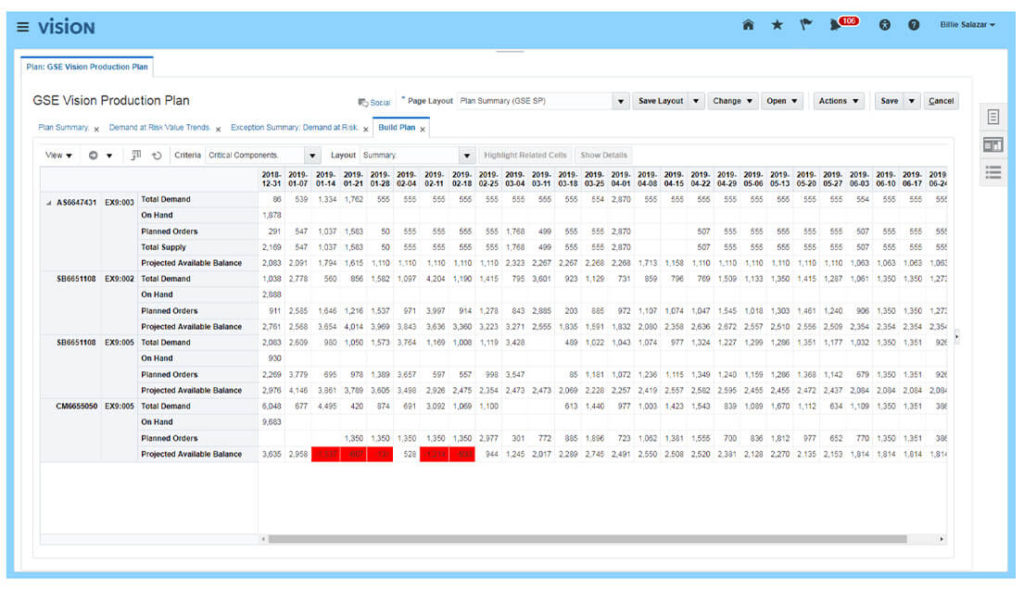
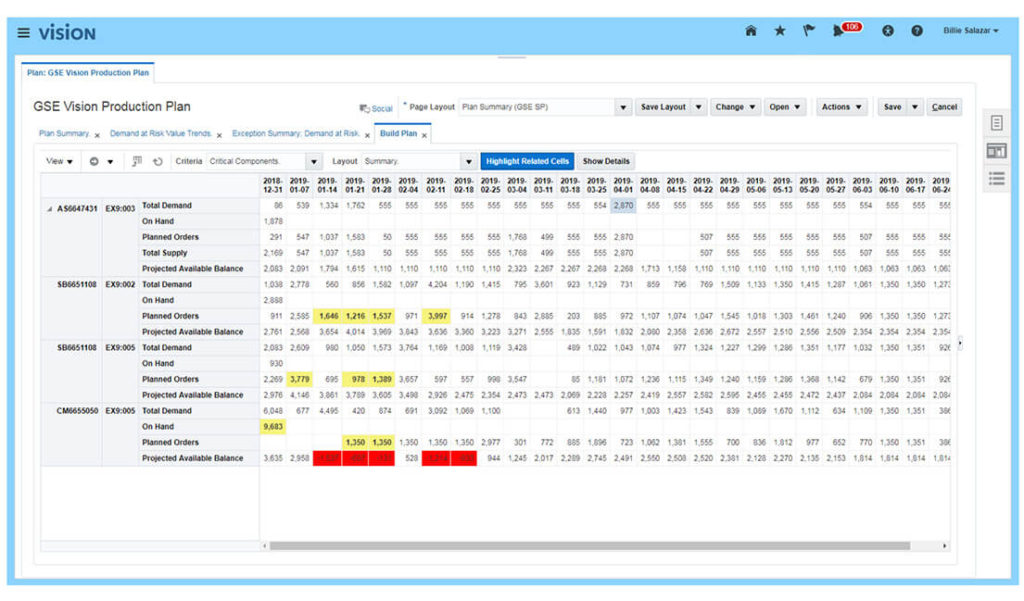
By selecting a high demand quantity for the end item and clicking on the Highlight Related Cells button, the related supplies of components are highlighted to the planner, this allows to identify the root cause of the negative PAB for the component.
Planner can plan an additional supply to manage these Demand at Risk exceptions or look at the Demand Fulfilment page to see if there are any recommendations provided by the plan.
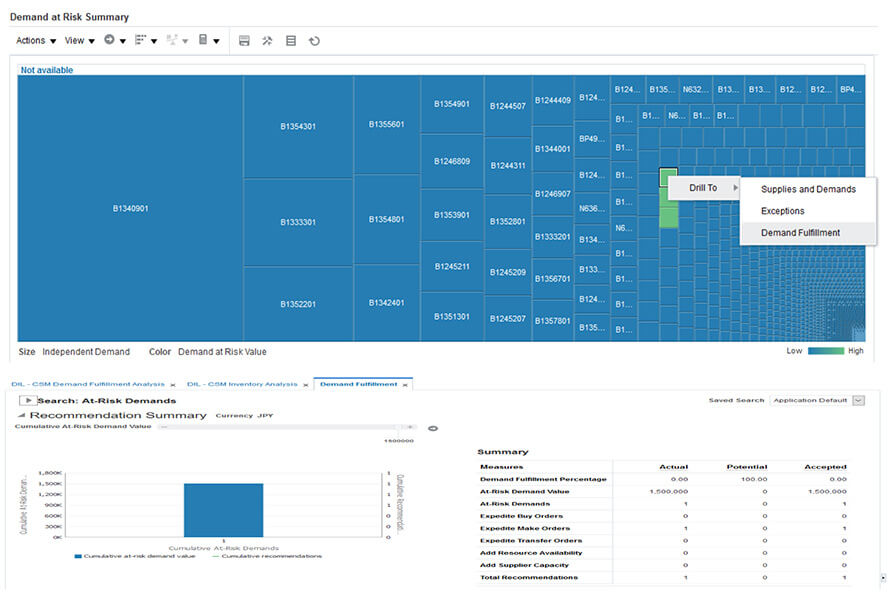
The chart on the Demand Fulfillment view shows the cumulative value of the demand that is at risk, plotted against the number of supply orders that Planning has recommended to meet those demand. Using this chart, Demand Fulfillment prioritizes and summarizes at-risk demands and related recommendations so that planner can achieve the greatest improvement to demand fulfillment position with least amount of effort. Planners can take actions to accept recommendations directly within Demand Fulfillment.
Inventory Analysis:
The Planning Engine also creates some standard Exceptions but it can also be altered to create entirely Custom Exceptions or to configure threshold above which only the Exceptions are reported, these enable the Planners to work on the Vital few exceptions based upon the business scenario.
For example, here we have created a custom exception for Stock-out as where ever the Projected On hand falls below a certain threshold value a Stock-out exception needs to be reported. These exceptions can be analyzed using the following graph.
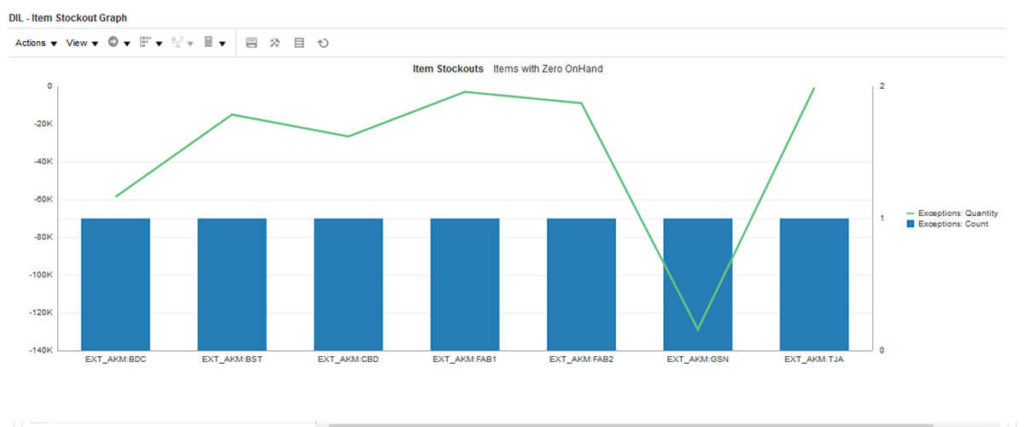
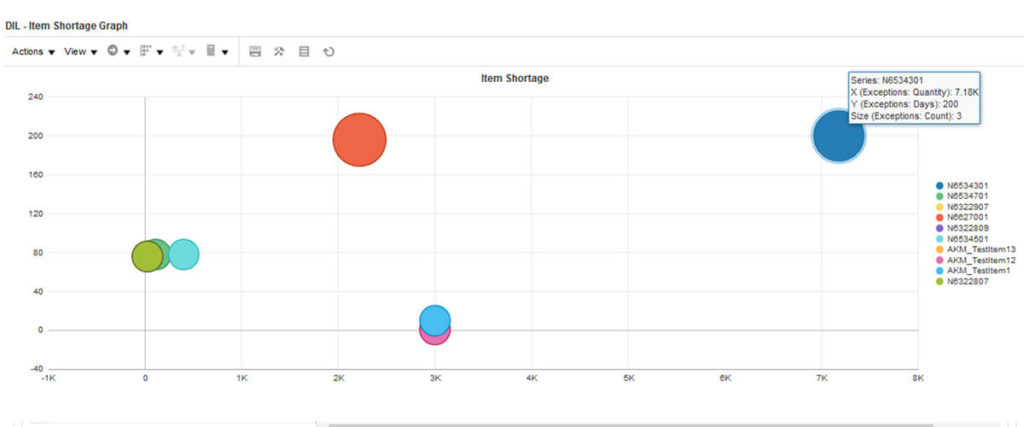
Similarly, Shortage and Excess exceptions can also be analyzed.
Inventory Turns projections are also automatically created by the Planning engine based upon the Cost and Price data input.
The Supply Planner would be interested in the following KPIs/Exceptions:
- Plan Recommendations for Buy Items (Purchasing)
- Plan Recommendations for Make Items (Production)
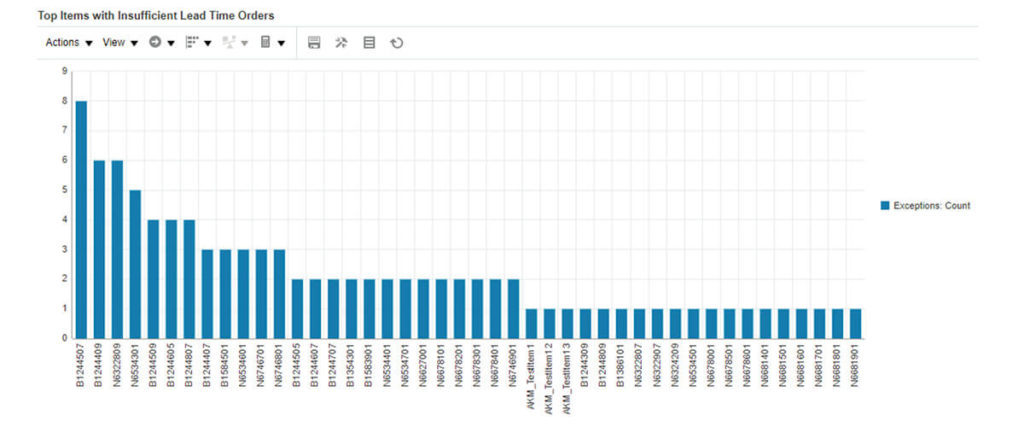
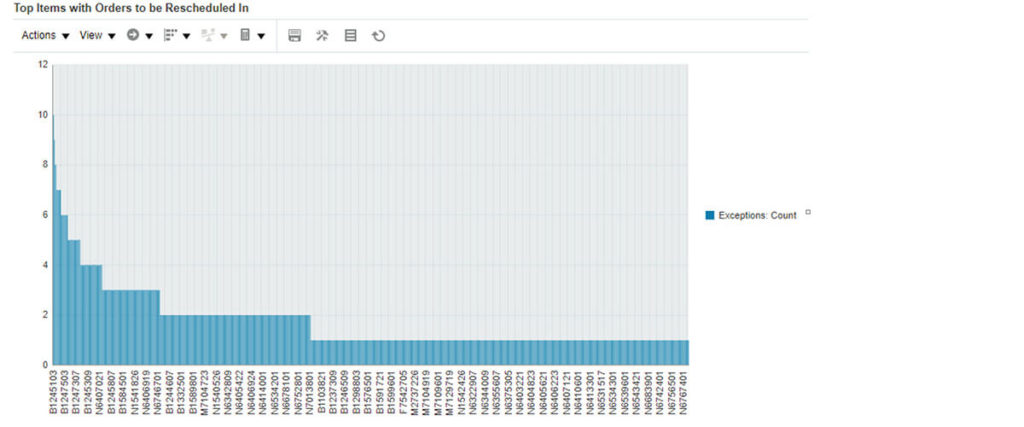
- Rescheduling Exceptions for existing Supply
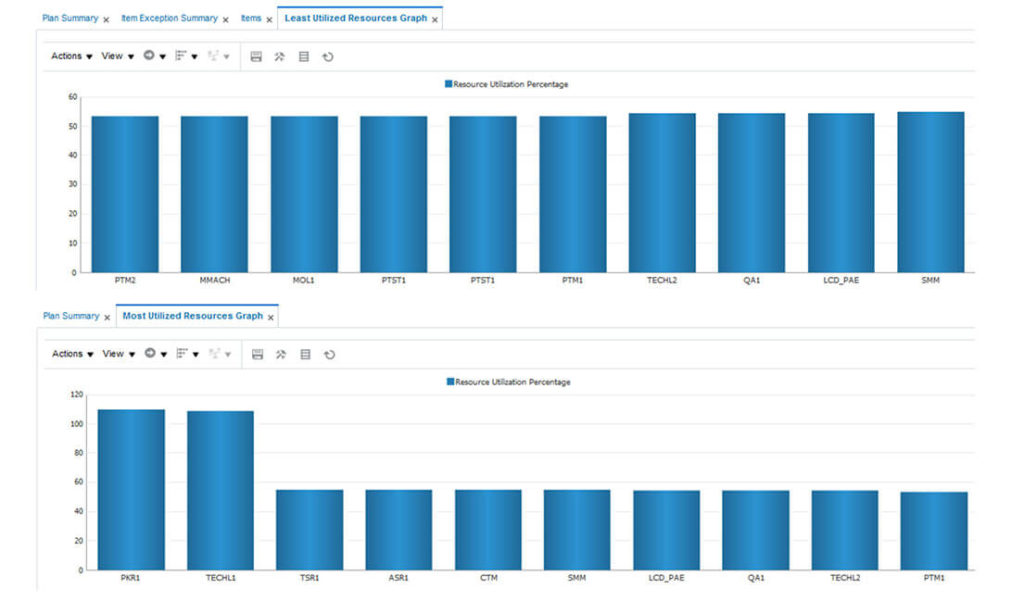
- Review Production Resource Constraints
- Review Supplier Capacity Constraints
A Summary Dashboard should be configured with the above KPIs and Exception Summaries as follows, where he/she can analyze the above metrics.
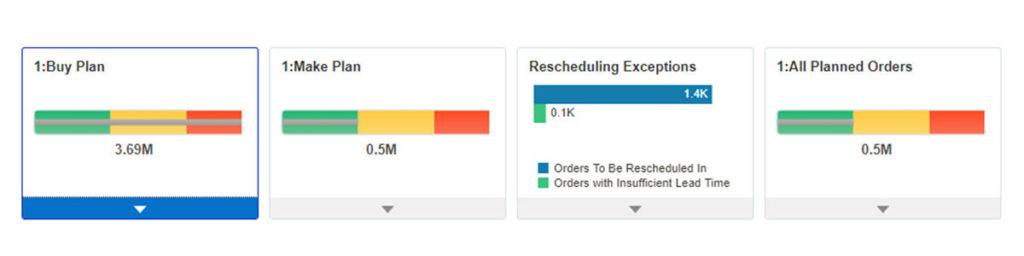
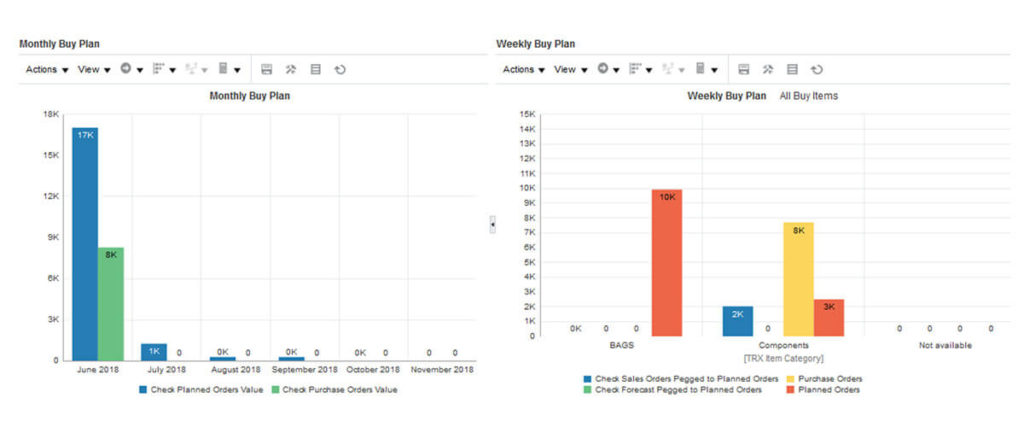
From the Buy and Make Plan Infotiles, the planner can get a summary view of the Monthly Requirements that can be compared to the Capacity/Quota of Suppliers. Also, Custom Measures can be configured that provide insights into the Importance of the Plan recommendations by looking at the pegging information, so recommendations pegged to Sales Orders take priority over others. The Weekly Plan also provide immediate Action Items to the Planners that need to be acted on.
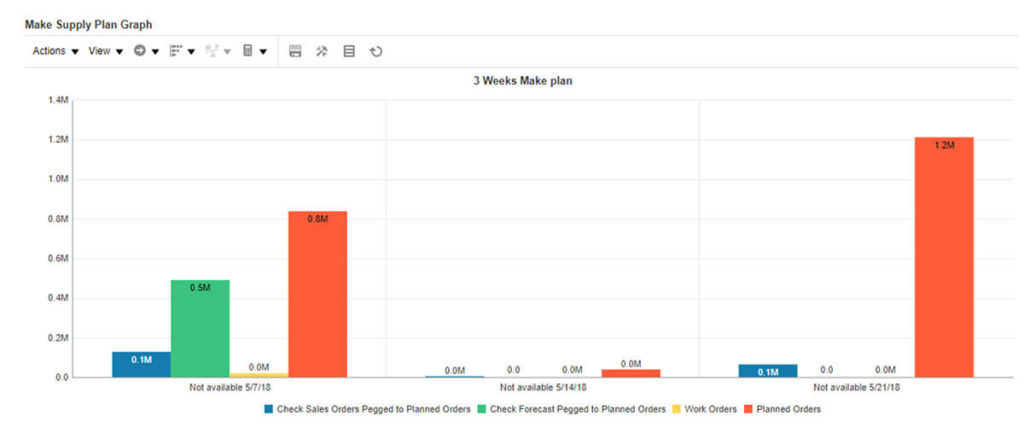
Also, the Planner is provided with Rescheduling and Expedite Recommendations to existing supplies that will enable to better meet demand in time.
Resource Utilization and Constraints can also be monitored by the Planner using the following :
The Sales Manager would be interested in the following KPIs/Exceptions:
- Forecast Comparison between the Statistical and Sales Forecasts
- Budget vs Plan projections, as per current plan
- Revenue and Margin projections, as per current plan
- Demand Fulfilment Exceptions by Region/Distribution Center
- Inventory Turns projections, as per current plan
A Summary Dashboard should be configured with the above KPIs and Exception Summaries as follows, where he/she can analyze the above metrics.
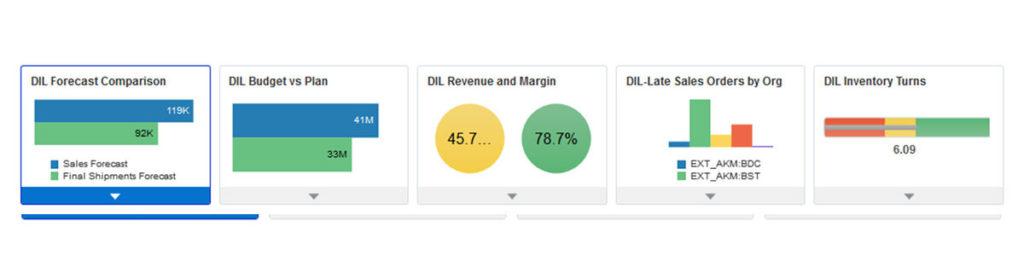
The Manager has the same visibility of Infotiles as the Planners with a more cross-functional view.
The additional Budget vs Plan, or other Manager specific Infotiles and Graphs and Tables can also be configured.
- Day in Life of Planner Oracle Training – Cloud Planning Applications
- Day in Life of Planner in Planning Central – Oracle Whitepaper

Arun Malhotra has more than 13 years of experience managing and implementing Oracle (EBS/VCP) On-premise Applications and Oracle Cloud suite of products in Supply Chain Planning. He is qualified MBA in Supply Chain Management and his focus areas are advisory and solutions consulting for organizations in Supply Chain Management, Supply Chain Planning and Manufacturing Execution.